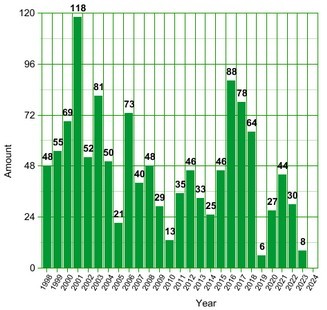
What the graph on the right shows me is that prior to HD radio, I did pretty well here. As more and more stations added HD, the amount of new loggings dropped dramatically. I already knew that, but I didn't realize just how bad it became. But around 2013 my new station total began to climb again, despite the fact that the IBOC sidebands are still there, and I've got LPFM stations now plus a bazillion new FM translators to clog channels. But again since 2021 I've been back on a downward spiral. We are currently headed into an active cycle 25. What does that mean? Good question. With the FM band being almost totally trashed and the solar cycle heading for maximum, it's too soon to tell, but last year was not a good year.
Antenna phasing didn't really help much last summer because the skip just wasn't there. If we get lots of skip events, I'll do okay. If it all crashes like last summer, I won't.
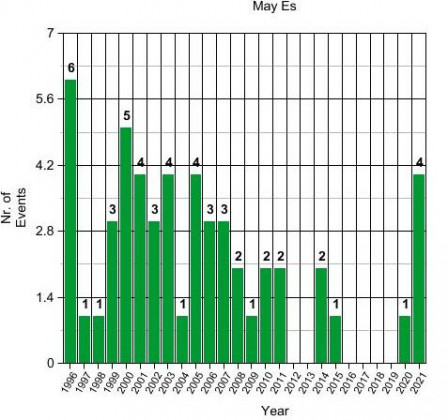
The graph to the left shows how the month of May fares for E-skip, at least here in New England. In the past it has been good but in recent years the amount of Es I've seen here has decreased drastically and it is to the point where I don't even consider May to be the start of skip season anymore.
The graph on the left runs from 1996 through 2021. After four years of no Es in May at all, May made a nice comeback in 2021. All of the Es events in May took place after the 21st of the month. None were blockbusters although the event on the 31st was pretty good.